System Profiling with Perfetto
Programs aren’t perfect and that doesn’t mean just bugs. Quite often a program will accomplish it’s goal, but not as quickly as both developers and users would like. Solving performance problems can be complicated, but it often starts at identifying why a program is slow via profiling. Profiling informs what a codebase is doing, how the work is being done, in what order code is being executed, and quite often highlights the hotspots where a few lines of code account for most of the time. Programmers have a wide variety of tools for profiling nowadays, though like most tools they do have trade-offs which create specializations. The tools can vary considerably due to the execution environment, target programming languages, and assumed root causes of a program being slow. Note, I do have to say assumed root cause because until you can quantify the behavior of a program you only have educated guesses.
Types of Profilers
Profilers will quantify the question of "How long does it take to do X?",
but the profilers don’t need to be complex.
For instance I could sit down, look at a program and say
"I think function X() is taking longer than expected".
System timers could quantify how long a program takes to run with time (e.g. a
unit test for X()) or code can be modified to collect the runtime of X()
void
some_function(void)
{
    struct timespec start, end;
    //Record the time before entering X()
    clock_gettime(CLOCK_MONOTONIC, &start);

    X();

    //Record the time after exiting X()
    clock_gettime(CLOCK_MONOTONIC, &end);

    printf("X took %f ms\n", get_timediff_ms(end, start));
}
At the end of the day how it takes to run a critical section of code is what
matters, though getting only a single time for a program is a very coarse metric.
It’s possible that we can see what our target function X() calls and then
annotate Y(), Z(), etc, though that is slow work and can produce hard to
understand output.
We don’t need to add these timers ourselves though as automated tooling exists.
Sampling profilers like perf, gprof, or the-poor-man’s-profiler automate our work by periodically capturing a stacktrace of a program without manual annotations. Quite often sampling profilers focus on slower events (e.g. being IO bound) and sequences of operations. A major weakness from my experiences with sampling profilers is the tooling to visualize the output of the collected traces is lackluster. My opinions are very much colored by the types of application optimization hurdles that I’ve needed to fix in the past, so take my opinion with a grain of salt.
My favored type of profiler is the instrumenting profiler which involves modifications to the program to generate information about the execution flow. Out of all of the instrumenting profilers, valgrind is my go-to tool. Valgrind automates the instrumentation needed to perform profiling, to track memory allocations, and to detect several classes of memory faults common in C and C++ programs. Valgrind executes every instruction in a VM and thus can see the exact pathway the program uses, but at a fairly high cost. A program executing 20x slower under valgrind isn’t unexpected, but that’s the price paid for convenient access to a program’s behavior. If you are working with compute bound single threaded tasks I can’t recommend kcachegrind’s visualization of valgrind’s output enough.
System Profilers
So, why do we need anything more than the profilers already mentioned? Well, a lot of the tools don’t do a great job at representing performance issues that occur across multiple threads, multiple programs, or are centered around inconsistencies in resources external to an application (IO/drivers/etc). A fair number of these problems are difficult to manage in the best of times and they’re becoming more common as system complexity increases with more powerful hardware. Sampling profilers can be used in some of these situations to generate traces, though as I mentioned before the data visualization associated with the sampling profilers is non-ideal to non-existent. Although I love valgrind, the output of the profiling is more focused on a statistical overview rather than a sequential trace of what’s happened. So, let’s take a look at another instrumenting profiler, Perfetto.
Perfetto is in the domain of system level profilers, which I haven’t had many chances to work with. In fact, I’ve tended to avoid those options since they’re quite frequently built around server system profiling which can be both quite complex to setup and focus around understanding even more complex systems that you might just want to avoid. Recently though I had to bite the bullet as the new complexity was justifiable.
Perfetto is an instrumenting profiler, but in this case the instrumentation isn’t inserted automatically. Manual instrumentation isn’t ideal, but it does mean that effort can be spent on only recording relevant events in traces. After instrumentation has been added to the source of an application, the program can be run, and events can be used to create a trace via a logging daemon. With a daemon monitoring events, multiple applications can be logged simultaneously, information about system state can be logged to the daemon, and Perfetto showcases these features.
Being able to log out complex profiling traces is next to useless without good data visualization, but Perfetto provides the needed tooling. The logged data can be visualized in a multi-threaded, multi-application, flame graph style view with additional events flagged as needed, and metrics plotted over time. If that doesn’t sound like enough, the logged information can be queried via a SQL style interface, which comes in handy for when you want to programmatically aggregate results. I do certainly miss the full trace summaries present in kcachegrind, so it isn’t perfect, but it does a solid job at answering: "What happened at 50 seconds into this program run?".
How does Perfetto help you visualize program traces?
So, what does Perfetto look like in practice? The main view is a collection of flamegraphs in separate tracks. Each track is likely to be a different thread of execution or a separate process. Each event in the flamegraph typically represents one function call, though since they’re user defined it’s much more coarse than watching the true callstack.
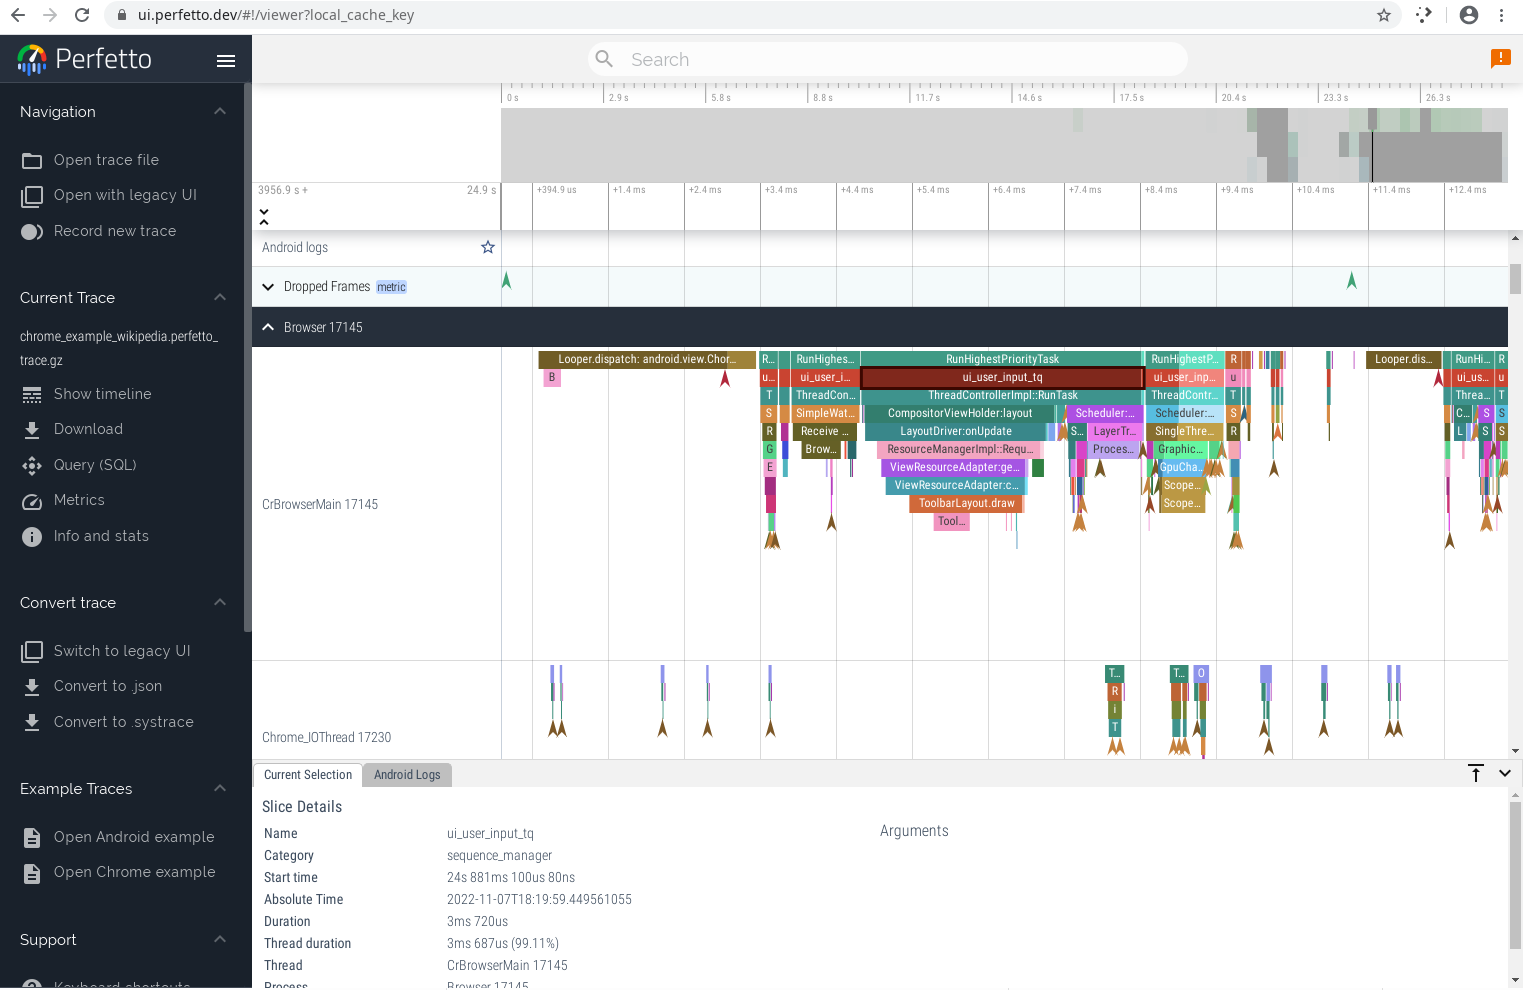
The UI lets you see the total elapsed period of time recorded in a trace and lets you smoothly zoom into smaller and smaller segments of time. Vertically all of the tracks are stacked on each other highlighting the individual applications recorded, individual threads within the applications, and get detail information on any of the individual segments.
It’s even possible to query the recorded events using SQL.
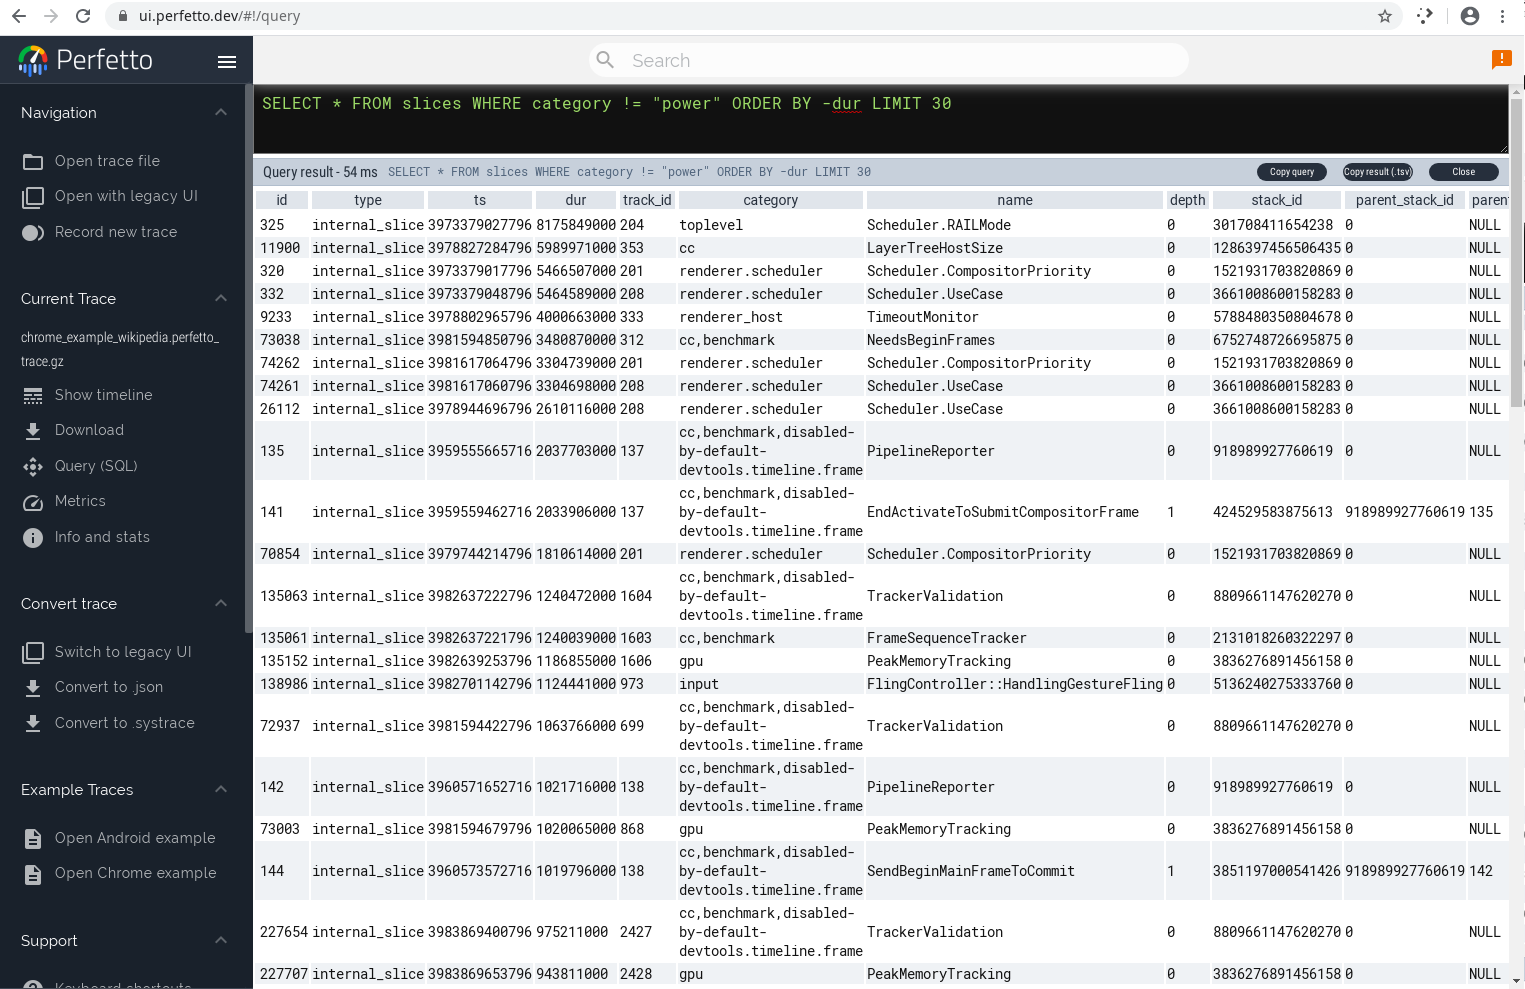
Why would you want to query the profiling traces with SQL? Well, queries can be used to aggregate performance with modest difficulty as opposed to the task being a monumental exercise in reverse engineering of the formats used to store the serialized traces.
Speed
You never want to encounter a Heisenbug, or in other words a bug which disappears when it’s observed. We all have had them: the hardware glitch that can’t replicate when you show it to someone, a web browser that works only in developer mode… It’s enough to build superstitions. The same problem can and does arise in profiling because at the end of the day by observing the program you’re altering the speed it’s being run at. Even slight changes in the speed can make some bottlenecks disappear, new ones appear, and when your tools are unreliable you can waste time fixing problems that were never really there in the first place. That’s not even considering how changing the speed of a program can impact various data races and other quirks of threading behavior.
So, ideally when profiling the speed of the underlying program should be as close as is possible to normal operations. Valgrind clearly violates that principle with 20x slowdowns, but that is why those profiles tend to be useful primarily for compute bound profiling tasks. Perfetto addresses this concern by making trace events lightweight and cheap to record. From Perfetto documentation we can see that every logged event is very cheap:
Scenario |
Runtime on Pixel 3 XL |
Runtime on ThinkStation P920 |
|
2 ns |
1 ns |
|
285 ns |
630 ns |
|
304 ns |
663 ns |
|
354 ns |
664 ns |
|
2 ns |
1 ns |
|
133 ns |
58 ns |
How is Perfetto integrated?
The biggest drawback of Perfetto is that events need to be manually added to the
application(s) being profiled.
Events are added through one of several macros or functions with a few of them
being documented in the table listing event tracing costs.
The primary macro is TRACE_EVENT(), which creates a scope bound
event with a category, a name, and optionally a set of keys/values pairs.
Thanks to C++'s RAII, trace event create a starting event along with an ending
event which is passed into the generated profiling trace.
Typically you’ll see code along the lines of:
void
func_name(int arg1) {
    TRACE_EVENT("some_category", "func_name", "arg1", arg1);
    //Do the normal work of the function
}
While the TRACE_EVENT() macro is the most common method for sending events,
there’s also more advanced methods which enable flags, counters, flows, and
as was shown in the previous table even faster data logging.
Counters for instance provide a way of storing a quantitative measure over time
such as worker’s assigned to a task, the current framerate, system fan speed,
etc.
With a time series plot in the data visualization it’s all the easier to hone
into the specific parts of the trace that you care to analyze.
Some of the functionality of Perfetto is still in flux, but as it stands it’s
quite a powerful tool to add to a diagnostic toolbox.
In Summary
Overall Perfetto is a pretty neat profiling suite. It’s not the first hammer in my toolbox that I’d bring out to optimize or otherwise understand a codebase, but when you need a way of understanding a multi-thread or multi-process system it’s the sledge that will get the job done. So, next time you have an eldritch horror of a computer system to tame, consider checking Perfetto out. Better yet, to explore the data visualization load up one of the pre-recorded example traces available in the online user interface.