Profiling Realtime Code
Generally profiling software results in observing some statistics that indicate what would need to be changed to increase total throughput. This does overlook the responsiveness of a design or in terms of a realtime system the overall distribution of response times. For any sort of hard realtime system you can have great throughput, but it would be meaningless if you take one extra millisecond than is allotted one out of a million times. So, how should this information be measured?
One solution that I’ve been experimenting with has been using valgrind to instrument the realtime callback. So without dragging this on, lets look at a valgrind command line needed to extract out the data:
valgrind --tool=callgrind \
             --zero-before="Master::AudioOut(float*, float*)" \
             --dump-after="Master::AudioOut(float*, float*)" \
             --dump-instr=yes --collect-jumps=yes \
             --collect-systime=yes --collect-bus=yes \
             --separate-threads=yes ./zynaddsubfx
So, what will this do? The zero before and dump after combination will reset valgrind’s profiling information every time it enters the function and then it will dump the profiling data out at the end of the function. This effectively means each output file contains one run of the function. The next few options get valgrind to collect a bunch of information which tends to be very useful for debugging why stuff takes a while. The last option may or may not be needed if the program to be tested is really multithreaded or not as it separates instructions form each thread; this stops the function trace from getting polluted.
In the case of the example command line the Master::AudioOut() function refers to ZynAddSubFX’s audio processing callback which by default needs to be evaluated every 5.3 ms. For this test it is just repeatedly called with an appropriate sleep() call keeping the loop speed around the same pace. After running the code for a short while ~1100 callgrind traces were produced. Extracting the timing information from them was pretty simple:
tail -qn 1 ./* | sed -e "s/totals: //" | sed -e "s/ .*//" | sort -n
Depending upon if you make any modifications to this setup or not the last data point might be the conglomeration of several function runs or it might end up being the statistics from another thread, so you’ll likely want to discard that last datapoint. So, what was just extracted? It grabs from the end of each trace the Instruction counts per function call (or perhaps cycle estimations if I’m mistaken). While this is not really the time spent doing a set action it should still provide a good measure of where the time is spent assuming that cache does not act too oddly in any given region of code (though you can enable the cache simulating portions of valgrind in this case).
So, since I’m references ZynAddSubFX it might be useful/interesting to show some of the data that motivated me in preserving these two command line snippets. Three trials were run by starting the program and running two notes and then hopping around the UI which generates a ton of events that need to get processed. The sorted collection of measurements for all the trials is shown below.
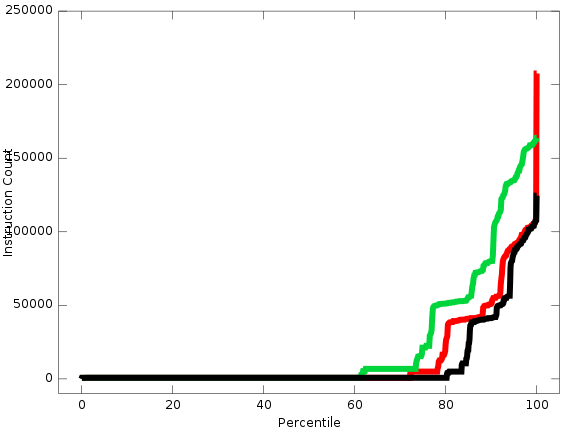
In general the runtime was very very short, but once the notes got running some longer run times were noticed and the spawning of new notes resulted in the large spike making up the worst case scenario. Since seeing this data, the message dispatch code has been tweaked to give up to a 4x boost in some cases and some further tweaks could gain ~5x speed gains for some access patterns. As per the worst case spike, some work has been done to change that, but this is a case of architectural surgery.
Another view that is helpful to look at is how this function behaves with respect to time. We can get at this data by just looking at the unsorted data:
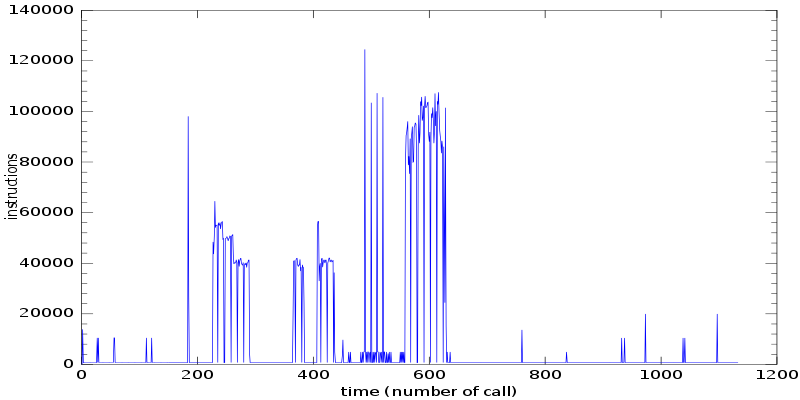
This view clearly shows when all of the events were triggered and approximately when various notes were getting processed. As per the odd jagged nature of the time series, that might indicate something odd happened when I was collecting the data, though I’m not entirely sure at the moment.
Now with all of this data you can track down which frames took the longest and just use kcachegrind to inspect them as you would with a normal callgrind trace. While this approach may seem imperfect it is great for finding codepaths that take up more time than expected.
Well, that’s all for now, hopefully this is useful in some sense of the term.